[ntab Configuration]
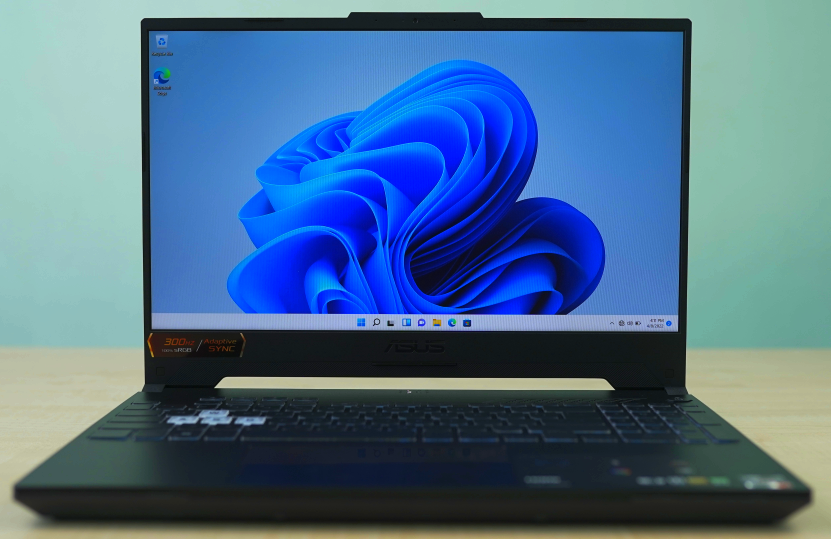
The TUF (The Ultimate Force) line-up from Asus, which consists of budget gaming laptops, got upgraded this year with an improved cooling solution, new displays and most notably, new CPUs from both Intel and AMD.
The version equipped with Intel’s latest 12th gen processor has the “F15” designation. It comes with either the i5-12700H or i7-12700H processors, both of which feature the “big.LITTLE” technology. “big.LITTLE” means that the CPU has two kinds of cores: some efficient ones that the laptop uses for less intensive tasks to improve battery life and some powerful cores that kick in when the user is performing more intensive tasks, like gaming.
The AMD variant has the “A15” designation and comes equipped with the latest Ryzen 7 6800H CPU, which is built on the 6nm technology and features one of the most powerful integrated graphics cards on the market, the AMD Radeon 680M.
We already did an in-depth review of the Intel variant (the F15), so if you want more general information about the laptop, please click this link for more info. Since both Intel and AMD versions have the same chassis, in this review, we will focus more on the performance difference between the two.
| Full name: ASUS TUF Gaming A15 FA507RM | ||
|---|---|---|
| Configuration specifications: | ||
| Display | 15.6-inch, 1920 x 1080 @ 300Hz, Matte, IPS TL156VDXP0101/TMX1561 | |
| Processor | AMD Ryzen 7 6800H @ 3.20 GHz | |
| Memory | Micron 16GB DDR5 4800 MHz (dual-channel) | |
| Video card | NVIDIA GeForce RTX 3060 6GB GDDR6 (GA106M) | |
| Wireless card | MediaTek MT7921 Wi-Fi 6 | |
| Storage | Samsung 1 TB M.2 PCIe SSD | |
| Battery | 90 WHr Li-Ion | |
| Operating system | Windows 11 Pro | |
| Full specifications here | ||
[ntab Display]
 |
Unlike the display on the F15, the one on the AMD variant is much more enjoyable and significantly better overall. The AMD variedcame with the TL156VDXP0101/TMX1561 panel, which is still Full HD, but it has a much higher refresh rate (300 Hz vs 144 Hz) and a better colour coverage of 95.8% sRGB, 68.4% Adobe RGB and 70.2% DCI P3, which makes it usable even for photo/video editing. It is also much brighter at 340 measured nits (versus 276 nits on the Intel version).
Here is a link to the calibrated display profile of the reviewed unit. Because each display is unique, this profile will not perfectly match other displays of the same model. Still, using this profile should give better overall colours.
 |
[ntab Benchmarks]

|
SCORE |
50930 |
|---|---|
| Graphics score | 93330 |
| Physics score | 14252 |
|
SCORE |
49825 |
|---|---|
| Graphics score | 98444 |
| Physics score | 13117 |

|
SCORE |
20978 |
|---|---|
| Graphics score | 22882 |
| Physics score | 25706 |
| Combined score | 11043 |
|
SCORE |
21185 |
|---|---|
| Graphics score | 22866 |
| Physics score | 27570 |
| Combined score | 11158 |

|
SCORE |
9027 |
|---|---|
| Graphics score | 8886 |
| Physics score | 9921 |
|
SCORE |
9499 |
|---|---|
| Graphics score | 9152 |
| Physics score | 12107 |

| Single-core score | Multi-core score |
| 1546 | 9658 |
| Single-core score | Multi-core score |
| 1724 | 11518 |

| Samples per minute: Monster | 100.293588 |
|---|---|
| Samples per minute: Junkshop | 59.658128 |
| Samples per minute: Classroom | 46.913892 |
| Samples per minute: Monster | 103.580081 |
|---|---|
| Samples per minute: Junkshop | 47.087932 |
| Samples per minute: Classroom | 37.154316 |
| Single-core score | Multi-core score |
| 1546 | 9658 |
| Single-core score | Multi-core score |
| 1724 | 11518 |
|
PCMark 10 AMD
|

|
PCMark 10 Intel
|
[ntab AMD vs INTEL Gaming benchmarks comparison]
[ntab Gaming benchmarks]
 |
[ntab Temperatures]
 |
Both TUF variants share the same chassis design, so they have the same cooling solution consisting of five heat pipes (two of which are shared between the CPU and GPU), four heatsinks (two on the back of the laptop and the rest on the sides) and two medium-sized fans.
The laptops were tested in real-usage scenarios (like gaming) and synthetic benchmarks with their Thermal Profile set to Turbo mode. In the analysis below, the focus will be more on AMD’s performance, but Intel’s results are also included for comparison reasons. Please read the full review here for more details on how the Intel version behaved during the tests.
All temperature measurements were performed at an ambient temperature of 24-25° C (75.2-77.0° F).
During the standard 30 minutes AIDA64 stress test (CPU, FPU, cache), the Ryzen 7 6800H reached an average temperature of 95°C (203°F), with a maximum of 95.4°C (203.7°F). Despite these temperatures, the processor managed to keep an average clock speed of 3.96 GHz, with a minimum frequency of 3.08 GHz. These speeds are pretty good given that the process has a minimum guaranteed frequency of 3.2 GHz and a maximum of 4.7 GHz.
| AIDA64 stress test | ||
|---|---|---|
| AMD | INTEL | |
| Average Frequency | 3.96 Ghz | 2.63 Ghz |
| Min Frequency | 3.08 Ghz | 2.59 Ghz |
| Average Temperature | 95°C (203°F) | 75 °C (167 °F) |
| Max Temperature | 95.4°C (203.7°F) | 97 °C (206.6 °F) |
In the combined AIDA64 + Unigine Superposition stress test (which had both the processor and the dedicated graphics card under heavy load for 30 minutes), the processor reached a maximum temperature of 95.5 °C (203.9°F) and throttled until it settled at a temperature of 94.6 °C (202.2 °F). During this test, the processor kept an average clock speed of 3.20 GHz, with occasional dips to as low as 2.58 GHz. The dedicated graphics card maintained an average clock speed of 1617 MHz with a maximum boost of 2077 MHz. Temperature-wise, the video card hovered between 84 °C (183.2 °F) and 87 °C (188.6 °F). Overall, it seems the cooling solution did a decent job since the average temperate is still equal to AMD’s guaranteed minimum speed of 3.20 GHz.
| AIDA64 plus Unigine Superposition test | ||
|---|---|---|
| AMD | INTEL | |
| Average Frequency | 3.20 Ghz | 2.06 Ghz |
| Min Frequency | 2.58 Ghz | 1.99 Ghz |
| Average Temperature | 94.6 °C (202.2 °F) | 80 °C (176 °F) |
| Max Temperature | 95.5 °C (203.9°F) | 97 °C (206.6°F) |
Finally, the laptop was tested with the AIDA64 stability test, another combined stress test for the video card and processor. The results were very similar to the previous stress tests. The processor reached a maximum temperature of 95.4 °C (203.7 °F) and throttled until it settled at a temperature of 94.1 °C (201.3 °F). Despite its throttling, the processor kept an average clock speed of 2.94 GHz, with occasional dips to as low as 1.88 GHz. The dedicated graphics card maintained an average clock speed of 1804 MHz with a maximum of 1995 MHz. Temperature-wise, the video card hovered between 85.8 °C (186.4 °F) and 87 °C (188.6 °F). Overall, it seems that in this extreme test, the laptop failed to maintain its minimum base speed of 3.20 GHz. In practice, such extreme load scenarios only happen in a few highly intensive, number-crunching applications. For gaming, the laptop cooling seems to be more than adequate.
| AIDA64 Stability test | ||
|---|---|---|
| AMD | INTEL | |
| Average Frequency | 2.94 Ghz | 2.21 Ghz |
| Min Frequency | 1.88 Ghz | 2.19 Ghz |
| Average Temperature | 94.1 °C (201.3 °F) | 88 °C (190.4 °F) |
| Max Temperature | 95.4 °C (203.7 °F) | 98 °C (208.4 °F) |
[ntab Battery life]
 |
| Battery details: | ||
|---|---|---|
| Device name: | A32-K55 | |
| Manufacturer Name: | ASUS | |
| Unique ID: | ASUS A32-K55 | |
| Designed Capacity: | 90006 mWh | |
| Full Charged Capacity: | 91655 mWh | |
Both laptops were rocking the same 90 Whr battery and were tested using a simulated continuous web browsing session over the WiFi. The browsing session involved checking emails/news, social media and accessing multimedia websites, similar to the behaviour of an average user. The level of brightness was set on both machines according to visibility and usability at 50%. The sound volume was also set to 50%.
The machines were tested using both Firefox and Edge and yielded similar battery life results regardless of the browser. The AMD version lasted 4 hours and 10 minutes with the Hybrid Mode turned on. This result is considerably better than the Intel version, which lasted only 1 hour and 35 minutes, although it is supposed to have the upper hand due to its “efficiency cores”.
Both laptops charged from 5% to 95% in 2 hours.
[ntab Conclusion]
Pros:
- good performance for 1080p gaming;
- 300Hz refresh rate panel;
- great color coverage display;
- decent keyboard;
- classic Numpad;
- MUX switch;
Cons:
- annoying high pitched noise fans
- sharp palmrest edges
So, which one is better? Well, both AMD and Intel versions had similar performance, with the Ryzen 7 6800H being better in multi-core intensive tasks, while the i7-12700H being slightly better in jobs where the single-core maximum frequency is more important. It seems that in the end, the price is the deciding factor. As a gamer, get whichever version is cheaper in your region since there is no noticeable gap in performance between the two versions.
Leave a Reply